AZO Stock Analysis: Identifying Bullish Patterns and Price Targets for Short and Medium-Term Trading
AZO Technical Analysis: Navigating the Bullish Surge with Precision
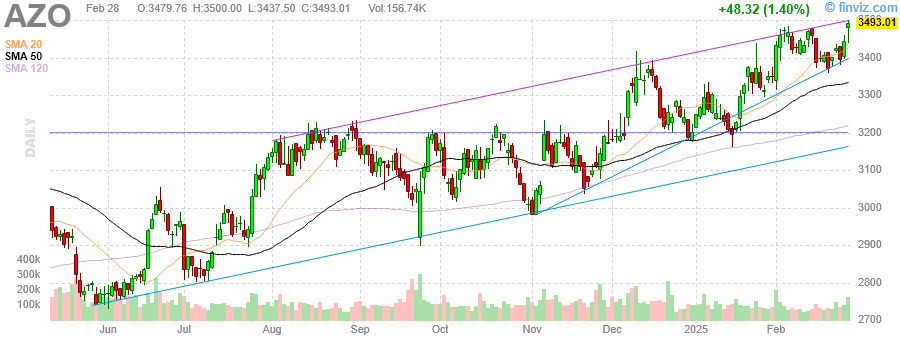
TLDR: AZO exhibits a strong bullish trend with key support at the 200-day SMA and resistance near the recent highs. Price action above all SMAs suggests continued upward momentum, with volume confirming the trend. Potential patterns include a bullish flag, with price targets set for short and medium-term movements.
1. Current Market Structure Assessment
-
Primary Trend: The primary trend for AZO is bullish. The stock has been in an uptrend since the beginning of the chart, with higher highs and higher lows.
-
Key Support and Resistance Levels:
- Support: The most significant support is around the 200-day SMA (currently at approximately $3000), which has acted as a dynamic support level.
- Resistance: The recent high at $3493.01 serves as immediate resistance. The next psychological resistance is at $3500.
-
Price Action in Relation to SMAs:
- The price is currently above all three SMAs (20, 50, and 120), indicating strong bullish momentum.
- The 20-day SMA ($3300) and 50-day SMA ($3200) have provided support during minor pullbacks, reinforcing the bullish sentiment.
-
Volume Patterns:
- Volume has generally increased during uptrends, particularly noticeable in November and December, confirming the price movements.
- There is a slight decrease in volume in recent months, but it remains above average, suggesting sustained interest.
2. Chart Pattern Identification
-
Completed or Emerging Patterns:
- A potential bullish flag pattern is forming, characterized by a sharp rise followed by a consolidation phase. This pattern suggests a continuation of the uptrend.
-
Trendlines:
- An upward trendline from the October low around $2500 supports the current price action.
- A descending trendline from the recent highs could act as resistance if the price consolidates further.
-
Gaps and Candlestick Patterns:
- No significant gaps are visible, but there are several bullish engulfing patterns, particularly in January, indicating strong buying pressure.
3. Price Projections and Scenarios
-
Bullish Scenario:
- Price Target: $3600 within the next 2-3 months, based on the flag pattern’s projected move.
- Entry: Around current levels or on a pullback to the 20-day SMA ($3300).
- Stop-Loss: Below the 200-day SMA at $2950.
- Risk-to-Reward Ratio: 1:3 (Risking $350 to gain $1050).
-
Bearish Scenario:
- Price Target: A pullback to $3100 within the next month if the flag pattern fails.
- Entry: Short position if price breaks below the 20-day SMA ($3300).
- Stop-Loss: Above the recent high at $3550.
- Risk-to-Reward Ratio: 1:2 (Risking $250 to gain $500).
4. Risk Assessment
-
Invalidation Points:
- A close below the 200-day SMA at $2950 would invalidate the bullish thesis.
- A significant drop in volume alongside a price decline would also signal a potential trend reversal.
-
Volatility Context:
- AZO has shown moderate volatility with occasional sharp moves, particularly in response to earnings or market sentiment shifts. Historical volatility suggests potential for 5-10% swings in short periods.
5. Summary
AZO’s technical analysis reveals a robust bullish trend supported by price action above key SMAs and confirmed by volume. The potential bullish flag pattern suggests continued upward movement, with a target of $3600 in the next 2-3 months. Key support is at the 200-day SMA ($3000), and resistance at recent highs ($3493.01). Traders should consider entering on pullbacks to the 20-day SMA with a stop-loss below the 200-day SMA, offering a favorable risk-to-reward ratio. Invalidation of this analysis would occur with a break below the 200-day SMA.
Actionable Insights:
- Short-term Traders: Look for buying opportunities around $3300 with a stop-loss at $2950, aiming for $3600.
- Medium-term Traders: Consider holding positions with a longer-term view, using the 200-day SMA as a dynamic stop-loss, targeting $3600 and beyond if the trend continues.
Additional Resources
You can visit Autozone Inc website here
Disclaimer: This analysis is for informational purposes only and does not constitute investment advice. All trading and investment decisions should be made based on your own research, experience, and risk tolerance.


Comments