BBY Stock Technical Analysis: Exploring Bullish Reversal Potential Amid Bearish Intermediate Trends
BBY Technical Analysis: Navigating Trends and Patterns for Strategic Trading [Daily Chart]
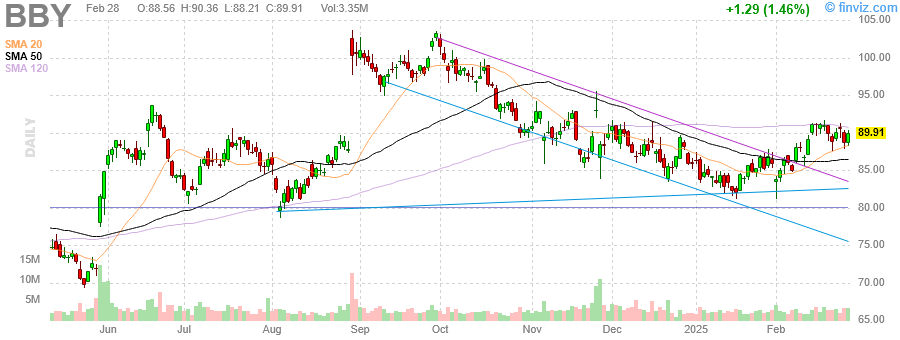
TLDR: BBY’s current market structure shows a bearish intermediate trend with potential for a bullish reversal. Key support and resistance levels, SMA interactions, and volume patterns suggest strategic trading opportunities with defined risk-reward scenarios.
1. Current Market Structure Assessment
Primary Trend:
- Bearish Intermediate Trend: The stock has been in a downtrend since mid-2023, with recent signs of potential reversal. The price is below the 20, 50, and 120-period SMAs, indicating a bearish sentiment in the intermediate term.
Key Support and Resistance Levels:
- Support:
- $75.00 (historical support level)
- $80.00 (recent support, tested in early 2024)
- Resistance:
- $85.00 (recent resistance, tested multiple times)
- $90.00 (psychological resistance)
Price Action in Relation to SMAs:
- The price is currently below the 20-SMA ($88.21), 50-SMA ($88.91), and 120-SMA ($89.91), indicating bearish momentum.
- Recent price action shows a potential bullish crossover as the 20-SMA is approaching the 50-SMA, which could signal a trend reversal if confirmed.
Volume Patterns:
- Volume has been relatively low during the downtrend, with slight increases during recent price spikes, suggesting potential accumulation or distribution.
- The recent uptick in volume alongside price increase in February 2024 indicates buying interest.
2. Chart Pattern Identification
Completed or Emerging Patterns:
- Potential Inverse Head and Shoulders: Forming with the left shoulder around $80.00, head at $75.00, and right shoulder at $80.00. Confirmation would require a breakout above the neckline at approximately $85.00.
- Trendlines: A descending trendline from mid-2023 highs is currently being tested, suggesting a potential breakout if breached.
Gaps and Candlestick Patterns:
- No significant gaps observed recently.
- A bullish engulfing pattern is visible in early February 2024, indicating potential reversal.
3. Price Projections and Scenarios
Bullish Scenario:
- Price Target: $90.00 (psychological resistance)
- Timeframe: 1-2 months
- Entry: Around current levels ($88.91)
- Stop-Loss: Below recent support at $80.00
- Risk-to-Reward Ratio: 1:4 (Entry at $88.91, Stop at $80.00, Target at $90.00)
Bearish Scenario:
- Price Target: $75.00 (historical support)
- Timeframe: 1-2 months
- Entry: Below $85.00 if the inverse head and shoulders pattern fails
- Stop-Loss: Above $88.00
- Risk-to-Reward Ratio: 1:2 (Entry at $84.00, Stop at $88.00, Target at $75.00)
4. Risk Assessment
Invalidation Points:
- Bullish Invalidation: Failure to break above $85.00 or a drop below $80.00 would invalidate the bullish scenario.
- Bearish Invalidation: A strong move above $90.00 would invalidate the bearish scenario.
Volatility Context:
- BBY has shown moderate volatility with significant price swings in the past year. The average true range (ATR) suggests a daily movement of approximately $2.00-$3.00, which should be considered for stop-loss placement.
5. Summary
BBY’s technical analysis reveals a bearish intermediate trend with emerging signs of a bullish reversal. Key support at $75.00 and $80.00, and resistance at $85.00 and $90.00, guide potential price movements. The interaction with SMAs and volume patterns supports a potential bullish scenario if the inverse head and shoulders pattern confirms.
Actionable Insights:
- Short-term Traders: Monitor for a breakout above $85.00 for a bullish entry with a target of $90.00. Use a stop-loss below $80.00.
- Medium-term Traders: Consider a bearish position if the price fails to break $85.00, targeting $75.00 with a stop-loss above $88.00. Keep an eye on the SMA crossover for trend confirmation.
This analysis provides a structured approach to trading BBY, balancing risk and reward based on technical evidence.
Additional Resources
View Best Buy Co Inc Stock Chart
You can visit Best Buy Co Inc website here
Disclaimer: This analysis is for informational purposes only and does not constitute investment advice. All trading and investment decisions should be made based on your own research, experience, and risk tolerance.


Comments