Cooper Companies Q1 2025 Analysis: Navigating Technical Support Amid Earnings Challenges
Cooper Companies Inc (COO): Technical Strength Amid Fundamental Challenges (Daily Chart)
TLDR
Cooper Companies presents a mixed investment case with strong technical support at current levels despite fundamental headwinds. Bullish scenario: Entry near $90.38 with targets at $95.00 (short-term) and $100.00 (medium-term), stop-loss at $88.00 (risk-reward 1:3.5). Bearish scenario: Short entry on rejection at $93.00, target $85.00, stop-loss at $95.00 (risk-reward 1:2.6). The company faces earnings pressure but maintains solid revenue growth and strong analyst support, suggesting potential for a technical reversal despite fundamental challenges.
Technical Analysis
Current Market Structure
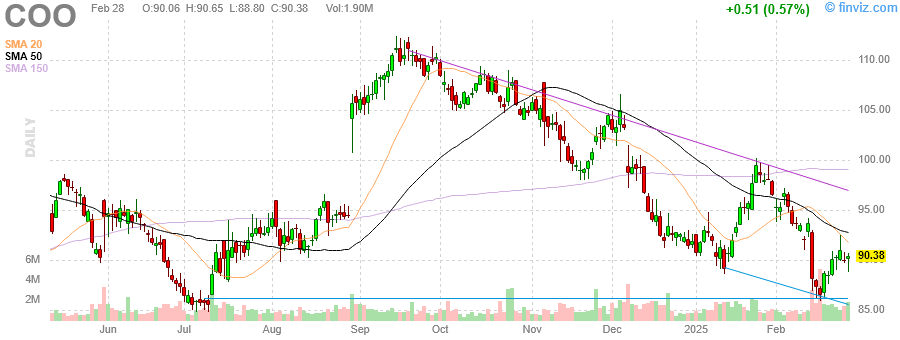
Cooper Companies is currently trading at a critical technical juncture. The primary trend has been bearish since November 2023, with the stock trading below all key moving averages. The price is currently testing significant support at $90.38, which coincides with previous price action from February 2024.
Key Support/Resistance Levels:
- Strong support: $90.38 (current level), $85.00 (February 2024 low)
- Key resistance: $93.00 (short-term), $95.00 (January 2024 high), $100.00 (psychological level)
The price action relative to moving averages confirms the bearish bias, with the 20-period SMA acting as immediate resistance and the 50-period SMA ($98.00) providing stronger overhead resistance.
Chart Patterns and Implications
A potential head and shoulders pattern is forming with the left shoulder at the July 2023 peak, the head at the November 2023 peak, and the right shoulder forming around January 2024. The neckline around $90.00 is currently being tested, making this a critical decision point.
The descending trendline from November 2023 intersects around $95.00, creating a significant resistance zone. Recent price action shows decreasing downside momentum as the stock approaches support, with volume patterns suggesting potential seller exhaustion.
Volume Analysis
Trading volume has been elevated during the recent downtrend, particularly during the January-February 2024 decline. However, volume has begun to decrease as price approaches the $90.38 support level, potentially indicating waning selling pressure. For a convincing reversal, we would need to see increased volume on upward price movements, particularly on a break above $93.00.
Fundamental Analysis
Financial Health Assessment
Cooper Companies maintains a relatively strong financial position despite recent challenges:
- Balance Sheet Strength: The company holds $138.2 million in cash with manageable debt levels.
- Profitability Metrics: Gross margins remain healthy at 66.8%, though operating margins have compressed to 15.6%.
- Return Metrics: Return on equity stands at 5.3%, below industry averages, indicating efficiency challenges.
The company’s debt-to-equity ratio of 0.35 is reasonable, providing financial flexibility during this challenging period.
Growth Trajectory
Cooper Companies shows mixed growth signals:
- Revenue Growth: Projected 6.9% revenue growth for the current year and 7.1% for next year demonstrates resilient top-line performance.
- Earnings Concerns: EPS is expected to decline by 8.5% in the current quarter, presenting a significant headwind.
- Forward Outlook: The company is projected to return to earnings growth in the coming fiscal year with 10.9% EPS expansion.
The revenue growth trajectory remains intact despite earnings pressure, suggesting operational rather than demand-related challenges.
Analyst Sentiment
Analyst sentiment remains surprisingly positive despite recent price weakness:
- Consensus Rating: Strong Buy (9 analysts)
- Price Target: $102.00, representing 12.9% upside from current levels
- Estimate Revisions: Mixed, with 3 upward and 2 downward revisions for the current quarter
The disconnect between strong analyst ratings and recent price action creates an interesting tension that could resolve in favor of the bulls if fundamental execution improves.
Trade Scenarios
Bullish Case
Entry Strategy: Buy at current support ($90.38) or on confirmation of reversal with a close above $93.00 Target Prices:
- First target: $95.00 (recent resistance) - 5.1% gain
- Second target: $100.00 (psychological level) - 10.6% gain
- Final target: $102.00 (analyst consensus) - 12.9% gain
Stop-Loss: $88.00 (below recent support) Risk-Reward Ratio: 1:3.5 to final target Timeframe: 2-3 months
Catalysts: Earnings surprise, margin improvement, or broader market recovery could accelerate the bullish case.
Bearish Case
Entry Strategy: Short on rejection at resistance ($93.00) or break below $90.00 Target Prices:
- First target: $88.00 (intermediate support) - 2.6% gain
- Second target: $85.00 (February low) - 5.9% gain
Stop-Loss: $95.00 (above recent resistance) Risk-Reward Ratio: 1:2.6 to final target Timeframe: 1 month
Catalysts: Earnings miss, margin deterioration, or broader market weakness could accelerate the bearish case.
Risk Factors
Technical Warning Signals
- Failure to hold the $90.38 support level would signal further weakness
- Declining volume on upward price movements would question sustainability of any rally
- A break below $85.00 would invalidate the current support structure and potentially trigger a larger decline
- The head and shoulders pattern completion (break below neckline) would target significantly lower prices
Fundamental Concerns
- The projected 8.5% EPS decline for the current quarter indicates operational challenges
- Compressed operating margins (15.6%) suggest cost pressures
- The relatively low ROE (5.3%) indicates suboptimal capital efficiency
- The P/E ratio of 37.9 remains elevated despite recent price declines, creating valuation risk
Conclusion
Cooper Companies presents a compelling technical setup at current levels despite fundamental headwinds. The stock is testing critical support at $90.38 with signs of selling exhaustion, creating a potential reversal opportunity. The strong analyst consensus rating (Strong Buy) and 12.9% upside to consensus price targets provide fundamental support for a technical reversal.
However, investors must weigh this against earnings pressure and valuation concerns. The projected 8.5% EPS decline and elevated P/E ratio of 37.9 suggest fundamental challenges that could limit upside potential.
Positioning Strategy
For risk-tolerant investors, a small long position at current levels with defined stop-loss at $88.00 offers an attractive risk-reward setup. More conservative investors should wait for confirmation of reversal with a close above $93.00 before establishing positions.
For those with a bearish outlook, waiting for a rejection at resistance ($93.00-$95.00) before establishing short positions would provide a better risk-reward profile.
In either scenario, position sizing should be conservative given the mixed signals between technical setup and fundamental outlook.
Disclaimer: This analysis is for informational purposes only and does not constitute investment advice. All trading and investment decisions should be made based on your own research, experience, and risk tolerance. Past performance is not indicative of future results.
Additional Resources
View Cooper Companies Inc Stock Chart
You can visit Cooper Companies Inc website here
Disclaimer: This analysis is for informational purposes only and does not constitute investment advice. All trading and investment decisions should be made based on your own research, experience, and risk tolerance.


Comments