GMS Inc. Quarterly Earnings Insights: Addressing Technical Weakness with Promising Growth Fundamentals
GMS Inc. Daily Chart Analysis: Balancing Technical Weakness Against Strong Fundamental Growth Outlook
TLDR: Investment Thesis
GMS presents a mixed investment case with bearish technical signals but solid fundamentals. Bullish scenario: Enter at $79.00 with target of $85.00 (stop at $76.00). Bearish scenario: Short at $79.00 with target of $74.00 (stop at $81.00). Current technical structure suggests caution, but strong earnings growth and analyst upgrades provide fundamental support.
Technical Analysis
Chart Specifications
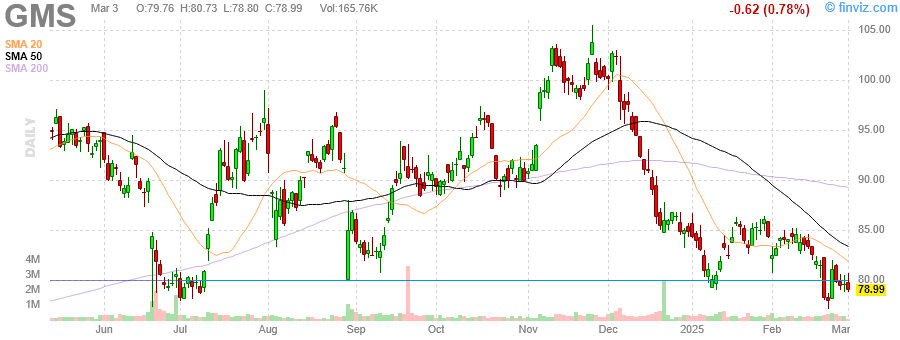
March 3, Daily timeframe with SMA 20, SMA 50, SMA 200, and volume indicators
Current Market Structure
The primary trend for GMS appears bearish, with price declining from approximately $100.00 to the current $79.00 level. Price is trading below all key moving averages:
- Below SMA 20 (~$82.00) - immediate resistance
- Below SMA 50 (~$86.00) - intermediate resistance
- Below SMA 200 (~$89.00) - long-term resistance, signaling bearish sentiment
Key support levels have formed at $76.00 (recent low) and $74.00, while resistance is established at $85.00 and $90.00.
Chart Patterns and Implications
Two significant patterns are developing:
- Emerging Head and Shoulders - with left shoulder at $95.00, head at $100.00, and right shoulder forming around $95.00. A break below the $85.00 neckline would confirm this bearish pattern.
- Descending Triangle - formed between $85.00 resistance and $79.00 support, typically a continuation pattern suggesting further downside.
Volume Analysis
Volume has been notably elevated during the recent downtrend, confirming selling pressure. A significant volume spike in late December 2022 coincided with a sharp price decline, indicating strong distribution. This volume profile supports the bearish technical outlook.
Fundamental Analysis
Financial Health Assessment
GMS demonstrates solid financial health with improving metrics:
- Debt Management: Total debt of $1.17B with a manageable debt-to-equity ratio
- Liquidity: Current ratio of 2.30 indicates strong short-term financial stability
- Profitability: Gross margin of 32.60% and operating margin of 9.20% show efficient operations
- Return Metrics: ROE of 24.25% and ROA of 7.78% demonstrate effective capital utilization
Growth Trajectory
GMS shows impressive growth momentum:
- Revenue Growth: Expected to reach $4.93B in FY 2023, representing 8.1% YoY growth
- Earnings Trajectory: Projected EPS of $8.75 for FY 2023, a substantial 16.7% increase from previous year
- Forward Outlook: FY 2024 projections indicate continued growth with revenue of $5.09B (+3.2%) and EPS of $8.95 (+2.3%)
Analyst Sentiment
Analyst consensus is decidedly positive:
- Average Rating: Strong Buy (1.8 on a scale of 1-5)
- Price Target: Consensus of $85.00 represents 7.6% upside from current levels
- Recent Actions: 5 analysts have raised estimates in the past 90 days vs. 0 lowering
- Valuation: Forward P/E of 8.9x suggests the stock is undervalued relative to growth prospects
Trade Scenarios
Bullish Case
- Entry Point: $79.00 (current level)
- Target: $85.00 (consensus analyst target and technical resistance)
- Stop-Loss: $76.00 (recent support)
- Risk-Reward Ratio: 1:2
- Timeframe: 2-4 weeks
- Catalyst: Strong earnings surprise or positive sector news could trigger a technical reversal
Bearish Case
- Entry Point: $79.00 (current level)
- Target: $74.00 (next support level)
- Stop-Loss: $81.00 (above recent consolidation)
- Risk-Reward Ratio: 1:2.5
- Timeframe: 2-4 weeks
- Catalyst: Market-wide weakness or disappointing guidance could accelerate the technical breakdown
Risk Factors
Technical Warning Signals
- Price trading below all major moving averages indicates persistent bearish momentum
- Potential head and shoulders pattern completion would signal further downside
- High volume on down days suggests continued institutional selling
- Break below $76.00 support could accelerate selling pressure
Fundamental Concerns
- Construction market slowdown could impact future revenue growth
- Rising input costs may pressure margins despite the company’s strong pricing power
- Slowing growth rate projected for FY 2024 (3.2% revenue growth vs. 8.1% in FY 2023)
- Macroeconomic headwinds including interest rates and housing market weakness
Conclusion
GMS presents an interesting dichotomy between bearish technical signals and positive fundamental outlook. The technical picture suggests caution with price below all major moving averages and bearish patterns forming. However, the fundamental story remains compelling with strong earnings growth, analyst upgrades, and attractive valuation metrics.
Recommended Positioning Strategy
For investors with medium to long-term horizons, the current technical weakness may present a buying opportunity given the solid fundamentals and analyst confidence. Consider:
-
Staged Entry Approach: Initiate a partial position at current levels ($79.00) with plans to add on either:
- Confirmation of technical support at $76.00
- Break above the SMA 20 at $82.00
-
Options Strategy: For sophisticated investors, selling cash-secured puts at the $76.00 strike could provide income while potentially acquiring shares at a lower basis.
-
Risk Management: Regardless of approach, maintain strict stop-losses and position sizing appropriate to the elevated volatility environment.
The disconnect between technical weakness and fundamental strength suggests that patient investors may be rewarded, but short-term traders should respect the current bearish technical structure until clear reversal signals emerge.
Disclaimer: This analysis is for informational purposes only and does not constitute investment advice. All trading and investment decisions should be made based on your own research, experience, and risk tolerance.


Comments