ROST Market Analysis: Bearish Intermediate Trends with Short-Term Bullish Reversals Potential
ROST Technical Analysis: Navigating the Current Market Dynamics
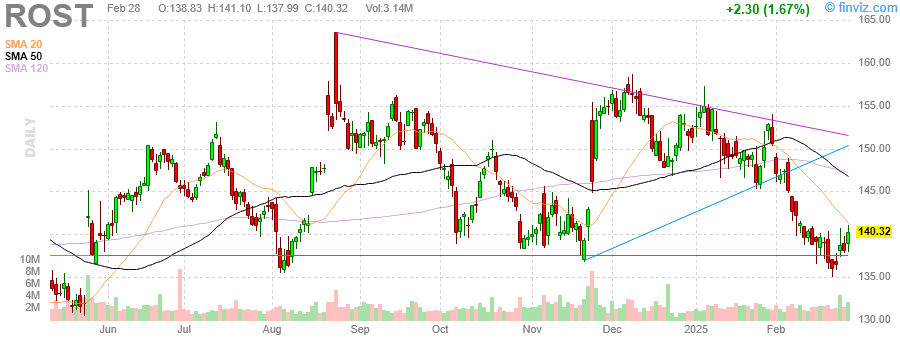
TLDR: ROST exhibits a bearish intermediate trend with potential for short-term bullish reversals. Key support at $140 and resistance at $160. Volume confirms recent price movements. Potential head and shoulders pattern forming with targets and risk assessments provided.
1. Current Market Structure Assessment
-
Primary Trend: The primary trend for ROST appears to be bearish in the intermediate term, as evidenced by the price action below the 50-period and 120-period SMAs. However, there are signs of short-term bullish momentum as the price has recently crossed above the 20-period SMA.
-
Support and Resistance Levels:
- Support: $140 (recent low), $135 (historical low)
- Resistance: $160 (recent high), $165 (psychological level)
-
Price Action Relative to SMAs:
- The price is currently above the 20-period SMA ($147.17), suggesting short-term bullish momentum.
- It remains below the 50-period SMA ($152.96) and 120-period SMA ($155.40), indicating bearish intermediate and long-term trends.
- The recent crossover above the 20-period SMA could signal a potential short-term reversal.
-
Volume Patterns:
- Volume has shown spikes during significant price movements, such as the drop in late October and the recent recovery in February.
- The volume increase during the recent price rise above the 20-period SMA confirms the bullish short-term movement.
2. Chart Pattern Identification
-
Completed or Emerging Patterns:
- A potential head and shoulders pattern is forming with the left shoulder around mid-September, the head in late October, and the right shoulder forming in early February.
- If confirmed, this pattern suggests a bearish continuation with a neckline around $140.
-
Trendlines:
- A descending trendline from the October high to the February high is visible, acting as resistance around $155.
- An ascending trendline from the February low supports the price around $145.
-
Gaps and Candlestick Patterns:
- No significant gaps are visible.
- A bullish engulfing pattern is observed in early February, indicating potential reversal.
3. Price Projections and Scenarios
-
Bullish Scenario:
- Target: $160 (resistance level)
- Timeframe: 2-4 weeks
- Entry: $148 (current price)
- Stop-Loss: $140 (below recent support)
- Risk-to-Reward Ratio: 1:4 (Risk $8 for potential $12 gain)
-
Bearish Scenario:
- Target: $135 (historical support)
- Timeframe: 4-6 weeks
- Entry: $148 (current price)
- Stop-Loss: $155 (above descending trendline)
- Risk-to-Reward Ratio: 1:2 (Risk $7 for potential $13 gain)
4. Risk Assessment
-
Invalidation Points:
- Bullish scenario invalidates below $140.
- Bearish scenario invalidates above $165.
-
Volatility Context:
- ROST has shown significant volatility, with a 20% drop from October to November and a 10% recovery in February.
- The Average True Range (ATR) over the past 3 months suggests a daily volatility of approximately $3.50.
5. Summary
ROST’s current market structure indicates a bearish intermediate trend with short-term bullish potential. Key support at $140 and resistance at $160 are crucial levels. The potential head and shoulders pattern adds a bearish bias, but short-term bullish signals from the 20-period SMA crossover provide trading opportunities. Volume confirms recent price actions, enhancing the reliability of the analysis.
Actionable Insights:
-
Short-term Traders: Consider a long position at $148 with a target of $160 and a stop-loss at $140, offering a favorable risk-to-reward ratio. Monitor for confirmation of the head and shoulders pattern.
-
Medium-term Traders: A bearish stance might be prudent, entering at $148 with a target of $135 and a stop-loss at $155. Be vigilant for any breakout above $165 which would invalidate this scenario.
This analysis provides a structured approach to trading ROST, balancing the potential for short-term gains with the risk of a longer-term bearish trend.
Additional Resources
View Ross Stores Inc Stock Chart
You can visit Ross Stores Inc website here
Disclaimer: This analysis is for informational purposes only and does not constitute investment advice. All trading and investment decisions should be made based on your own research, experience, and risk tolerance.


Comments