ONON Stock Analysis: Navigating Bullish Momentum Amid Key Resistance Levels and Price Projections
ONON Technical Analysis: Bullish Momentum with Key Resistance Ahead [Daily Chart]
TLDR:
- Bullish Scenario: Entry at $47.50, Target at $55.00, Stop-loss at $44.50. Risk-to-reward ratio: 1:2.5.
- Bearish Scenario: Entry at $47.50, Target at $42.00, Stop-loss at $50.00. Risk-to-reward ratio: 1:1.8.
1. Current Market Structure Assessment
Primary Trend:
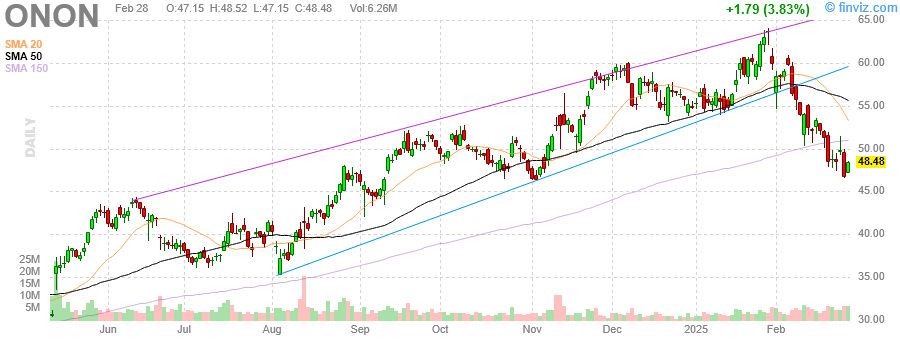
- The primary trend for ONON is bullish, as evidenced by the consistent upward movement and the price trading above all three SMAs (20, 50, and 150 periods).
Key Support and Resistance Levels:
- Support: $44.50 (recent low), $42.00 (psychological and historical support).
- Resistance: $50.00 (psychological and recent high), $55.00 (projected resistance based on trendline).
Price Action in Relation to SMAs:
- The price is currently above the 20-period SMA ($47.15), 50-period SMA ($44.48), and 150-period SMA ($41.00), indicating strong bullish momentum.
- The 20-period SMA is acting as a dynamic support, with the price respecting it during pullbacks.
Volume Patterns:
- Volume has shown a slight increase during the recent uptrend, confirming the price movement. However, there is a noticeable spike in volume around mid-October, which coincided with a price pullback, indicating potential distribution.
2. Chart Pattern Identification
Completed or Emerging Patterns:
- An ascending triangle pattern is forming, with the upper trendline acting as resistance around $50.00 and the lower trendline providing support.
- A flag pattern could be emerging after the recent breakout above $50.00, suggesting a continuation of the uptrend.
Trendlines:
- An upward trendline from the low in June 2023 supports the bullish trend. This trendline is significant as it has been tested multiple times.
- A horizontal resistance trendline around $50.00 has been tested and broken recently, indicating potential for further upside.
Gaps and Candlestick Patterns:
- No significant gaps are visible. However, a bullish engulfing pattern is noticeable in early February, reinforcing the bullish sentiment.
3. Price Projections and Scenarios
Bullish Scenario:
- Entry: $47.50 (current price)
- Target: $55.00 (based on the projection of the ascending triangle and flag pattern)
- Stop-loss: $44.50 (below recent support)
- Timeframe: 1-2 months
- Risk-to-reward ratio: 1:2.5
Bearish Scenario:
- Entry: $47.50 (current price)
- Target: $42.00 (historical support)
- Stop-loss: $50.00 (above recent resistance)
- Timeframe: 1-2 months
- Risk-to-reward ratio: 1:1.8
4. Risk Assessment
Invalidation Points:
- A close below $44.50 would invalidate the bullish scenario, suggesting a potential trend reversal.
- A close above $50.00 would invalidate the bearish scenario, confirming the bullish trend.
Volatility Context:
- ONON has shown increased volatility in recent months, with significant price swings. The average true range (ATR) suggests a volatility of around $2.00-$3.00 per day, which should be considered when setting stop-losses.
5. Summary
Current Market Structure: ONON exhibits a strong bullish trend with key support at $44.50 and resistance at $50.00. The price action is well-supported by all three SMAs, with volume confirming the upward movement.
Chart Patterns: An ascending triangle and a potential flag pattern are forming, both suggesting bullish continuation. Trendlines support the primary trend, with a recent breakout above $50.00.
Price Projections: For a bullish scenario, targeting $55.00 within 1-2 months offers a favorable risk-to-reward ratio. A bearish scenario targets $42.00, though less likely given current trends.
Risk Assessment: Invalidation points are critical at $44.50 for bullish and $50.00 for bearish scenarios. Historical volatility indicates careful stop-loss placement is necessary.
Actionable Insights:
- Short-term Traders: Consider entering at $47.50 with a tight stop-loss at $44.50, aiming for a quick move to $50.00 or higher.
- Medium-term Traders: Position for a longer-term hold towards $55.00, managing risk with a stop-loss at $44.50. Monitor for any signs of trend reversal or consolidation.
This analysis provides a structured approach for experienced traders and institutional investors to navigate ONON’s current market dynamics with precision and confidence.
Additional Resources
View On Holding AG Stock Chart
You can visit On Holding AG website here
Disclaimer: This analysis is for informational purposes only and does not constitute investment advice. All trading and investment decisions should be made based on your own research, experience, and risk tolerance.

Comments