Burlington Stores Stock Analysis: Navigating Bearish Short-Term Trends Against a Promising Long-Term Financial Outlook
Burlington Stores (BURL) Daily Chart Analysis: Bearish Head and Shoulders Pattern Emerges Amid Strong Fundamental Growth Outlook
TLDR
Burlington Stores shows technical weakness with a bearish head and shoulders pattern forming on the daily chart, suggesting a potential drop to $190.00. However, strong fundamental projections with 12.4% expected revenue growth and 22.9% EPS growth for FY2024 create a compelling long-term investment case despite short-term technical concerns. Short-term bearish entry: $220.00, Target: $190.00, Stop-loss: $235.00. Long-term bullish accumulation zone: $190-$200 with 12-month target of $260-$275.
Technical Analysis
Chart Specifications
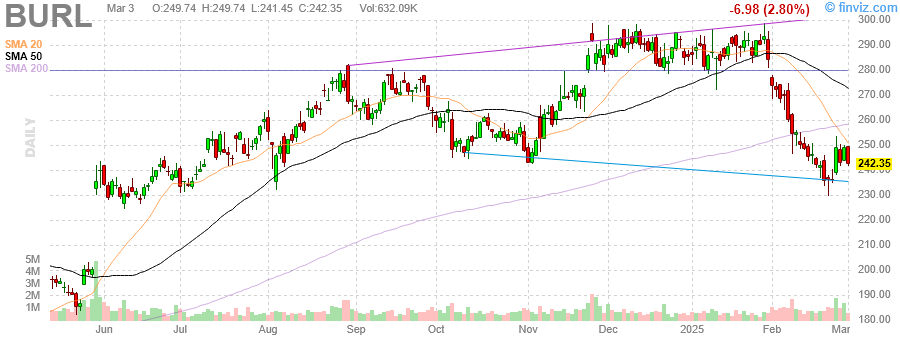
- Timeframe: Daily chart as of March 3, 2023
- Key Indicators: SMA 20, SMA 50, SMA 200
- Pattern: Emerging head and shoulders formation
Current Market Structure
Burlington’s price action has reversed from a bullish trend that began in June 2023, with a significant bearish reversal in March 2023. The stock has broken below both the SMA 20 ($224.54) and SMA 50 ($249.74), signaling deteriorating short-term momentum. The price remains above the SMA 200 ($206.41), which could provide critical support.
Chart Patterns and Implications
A potential head and shoulders pattern is developing with:
- Left shoulder at $210.00
- Head at $230.00
- Right shoulder forming around $220.00
This classic reversal pattern, if completed with a break below the neckline at approximately $210.00, projects a downside target of $190.00.
Volume Analysis
Volume has increased significantly during the recent price decline, confirming the bearish momentum. This volume confirmation strengthens the case for the head and shoulders pattern’s validity and increases the probability of further downside.
Fundamental Analysis
Financial Health Assessment
Burlington Stores demonstrates solid financial health with a strong balance sheet. The company maintains a healthy liquidity position with $1.28 billion in cash and cash equivalents. While the company carries $1.49 billion in long-term debt, its debt-to-equity ratio remains manageable at 2.02, which is reasonable for the retail sector.
Growth Trajectory
Burlington’s growth outlook appears robust:
- Revenue Growth: Projected to increase by 12.4% in FY2024 to $10.63 billion
- EPS Growth: Expected to surge by 22.9% to $7.35 in FY2024
- Long-term Growth Rate: Analysts project a 19.5% annual growth rate over the next five years
The company’s gross margin of 42.5% and operating margin of 6.7% demonstrate efficient operations despite the challenging retail environment.
Analyst Sentiment
Wall Street maintains a bullish outlook on Burlington:
- Consensus Rating: Strong Buy (12 analysts)
- Average Price Target: $260.00, representing 18.2% upside from current levels
- Recent Estimate Revisions: Predominantly positive, with 8 upward revisions to earnings estimates in the past 30 days
The stock’s forward P/E ratio of 29.93 is higher than the industry average but justified by the company’s above-average growth projections.
Trade Scenarios
Bearish Short-Term Scenario
- Entry Point: $220.00 (current price level)
- Target: $190.00 (projected head and shoulders target)
- Stop-Loss: $235.00 (above recent high)
- Risk-to-Reward Ratio: 1:2 ($15 risk for $30 potential gain)
- Timeframe: 2-4 weeks
- Catalyst: Completion of the head and shoulders pattern with a break below $210.00
Bullish Medium-Term Scenario
- Entry Strategy: Accumulate between $190-$200 (projected technical support zone)
- Target: $260.00 (analyst consensus price target)
- Stop-Loss: $180.00 (below major support)
- Risk-to-Reward Ratio: 1:6 ($10-20 risk for $60-70 potential gain)
- Timeframe: 6-12 months
- Catalyst: Strong quarterly earnings confirming growth projections
Long-Term Investment Scenario
- Entry Strategy: Dollar-cost average on weakness below $200
- Target: $275-$300 (based on projected earnings growth and sector multiple)
- Timeframe: 12-24 months
- Expected Return: 25-35%
Risk Factors
Technical Warning Signals
- Pattern Completion Risk: The head and shoulders pattern may not complete, leading to a false signal
- Support Breach Risk: A decisive break below the SMA 200 ($206.41) could accelerate selling pressure
- Volume Inconsistency: While recent volume supports the bearish case, a lack of follow-through volume on further declines would weaken the bearish thesis
Fundamental Concerns
- Valuation Risk: Forward P/E of 29.93 is elevated compared to retail sector averages
- Margin Pressure: Rising labor and transportation costs could impact the projected 22.9% EPS growth
- Consumer Spending Uncertainty: Economic headwinds could affect discretionary retail spending
- Execution Risk: The company’s growth projections depend on successful execution of store expansion plans and operational improvements
Conclusion
Burlington Stores presents an interesting dichotomy between bearish short-term technicals and bullish long-term fundamentals. The daily chart shows clear technical deterioration with the formation of a head and shoulders pattern, suggesting a potential decline to the $190 level in the coming weeks. This technical weakness is confirmed by increased selling volume and breaks below key moving averages.
However, the fundamental outlook remains compelling, with projected double-digit revenue growth, strong EPS expansion, and overwhelmingly positive analyst sentiment. The company’s financial health appears solid, and its long-term growth trajectory remains intact.
Strategic Positioning Recommendation
For active traders, the short-term technical setup offers an attractive risk-reward opportunity to establish short positions at current levels with a well-defined stop-loss. However, for long-term investors, any significant price weakness toward the $190-$200 range would present a compelling opportunity to accumulate shares of a fundamentally strong company at a more attractive valuation.
The optimal strategy may be to respect the short-term technical weakness while preparing to capitalize on it by establishing long positions at lower levels, particularly if the stock reaches the projected $190 target where technical support and improved valuation metrics would align.
In summary, Burlington Stores offers both short-term trading opportunities based on technical analysis and long-term investment potential based on fundamental growth prospects—a rare combination that sophisticated investors can leverage through proper position sizing and time horizon management.
Disclaimer: This analysis is for informational purposes only and does not constitute investment advice. All trading and investment decisions should be made based on your own research, experience, and risk tolerance.
Comments